Helping communities, businesses, and homeowners analyze and prepare for flood risk
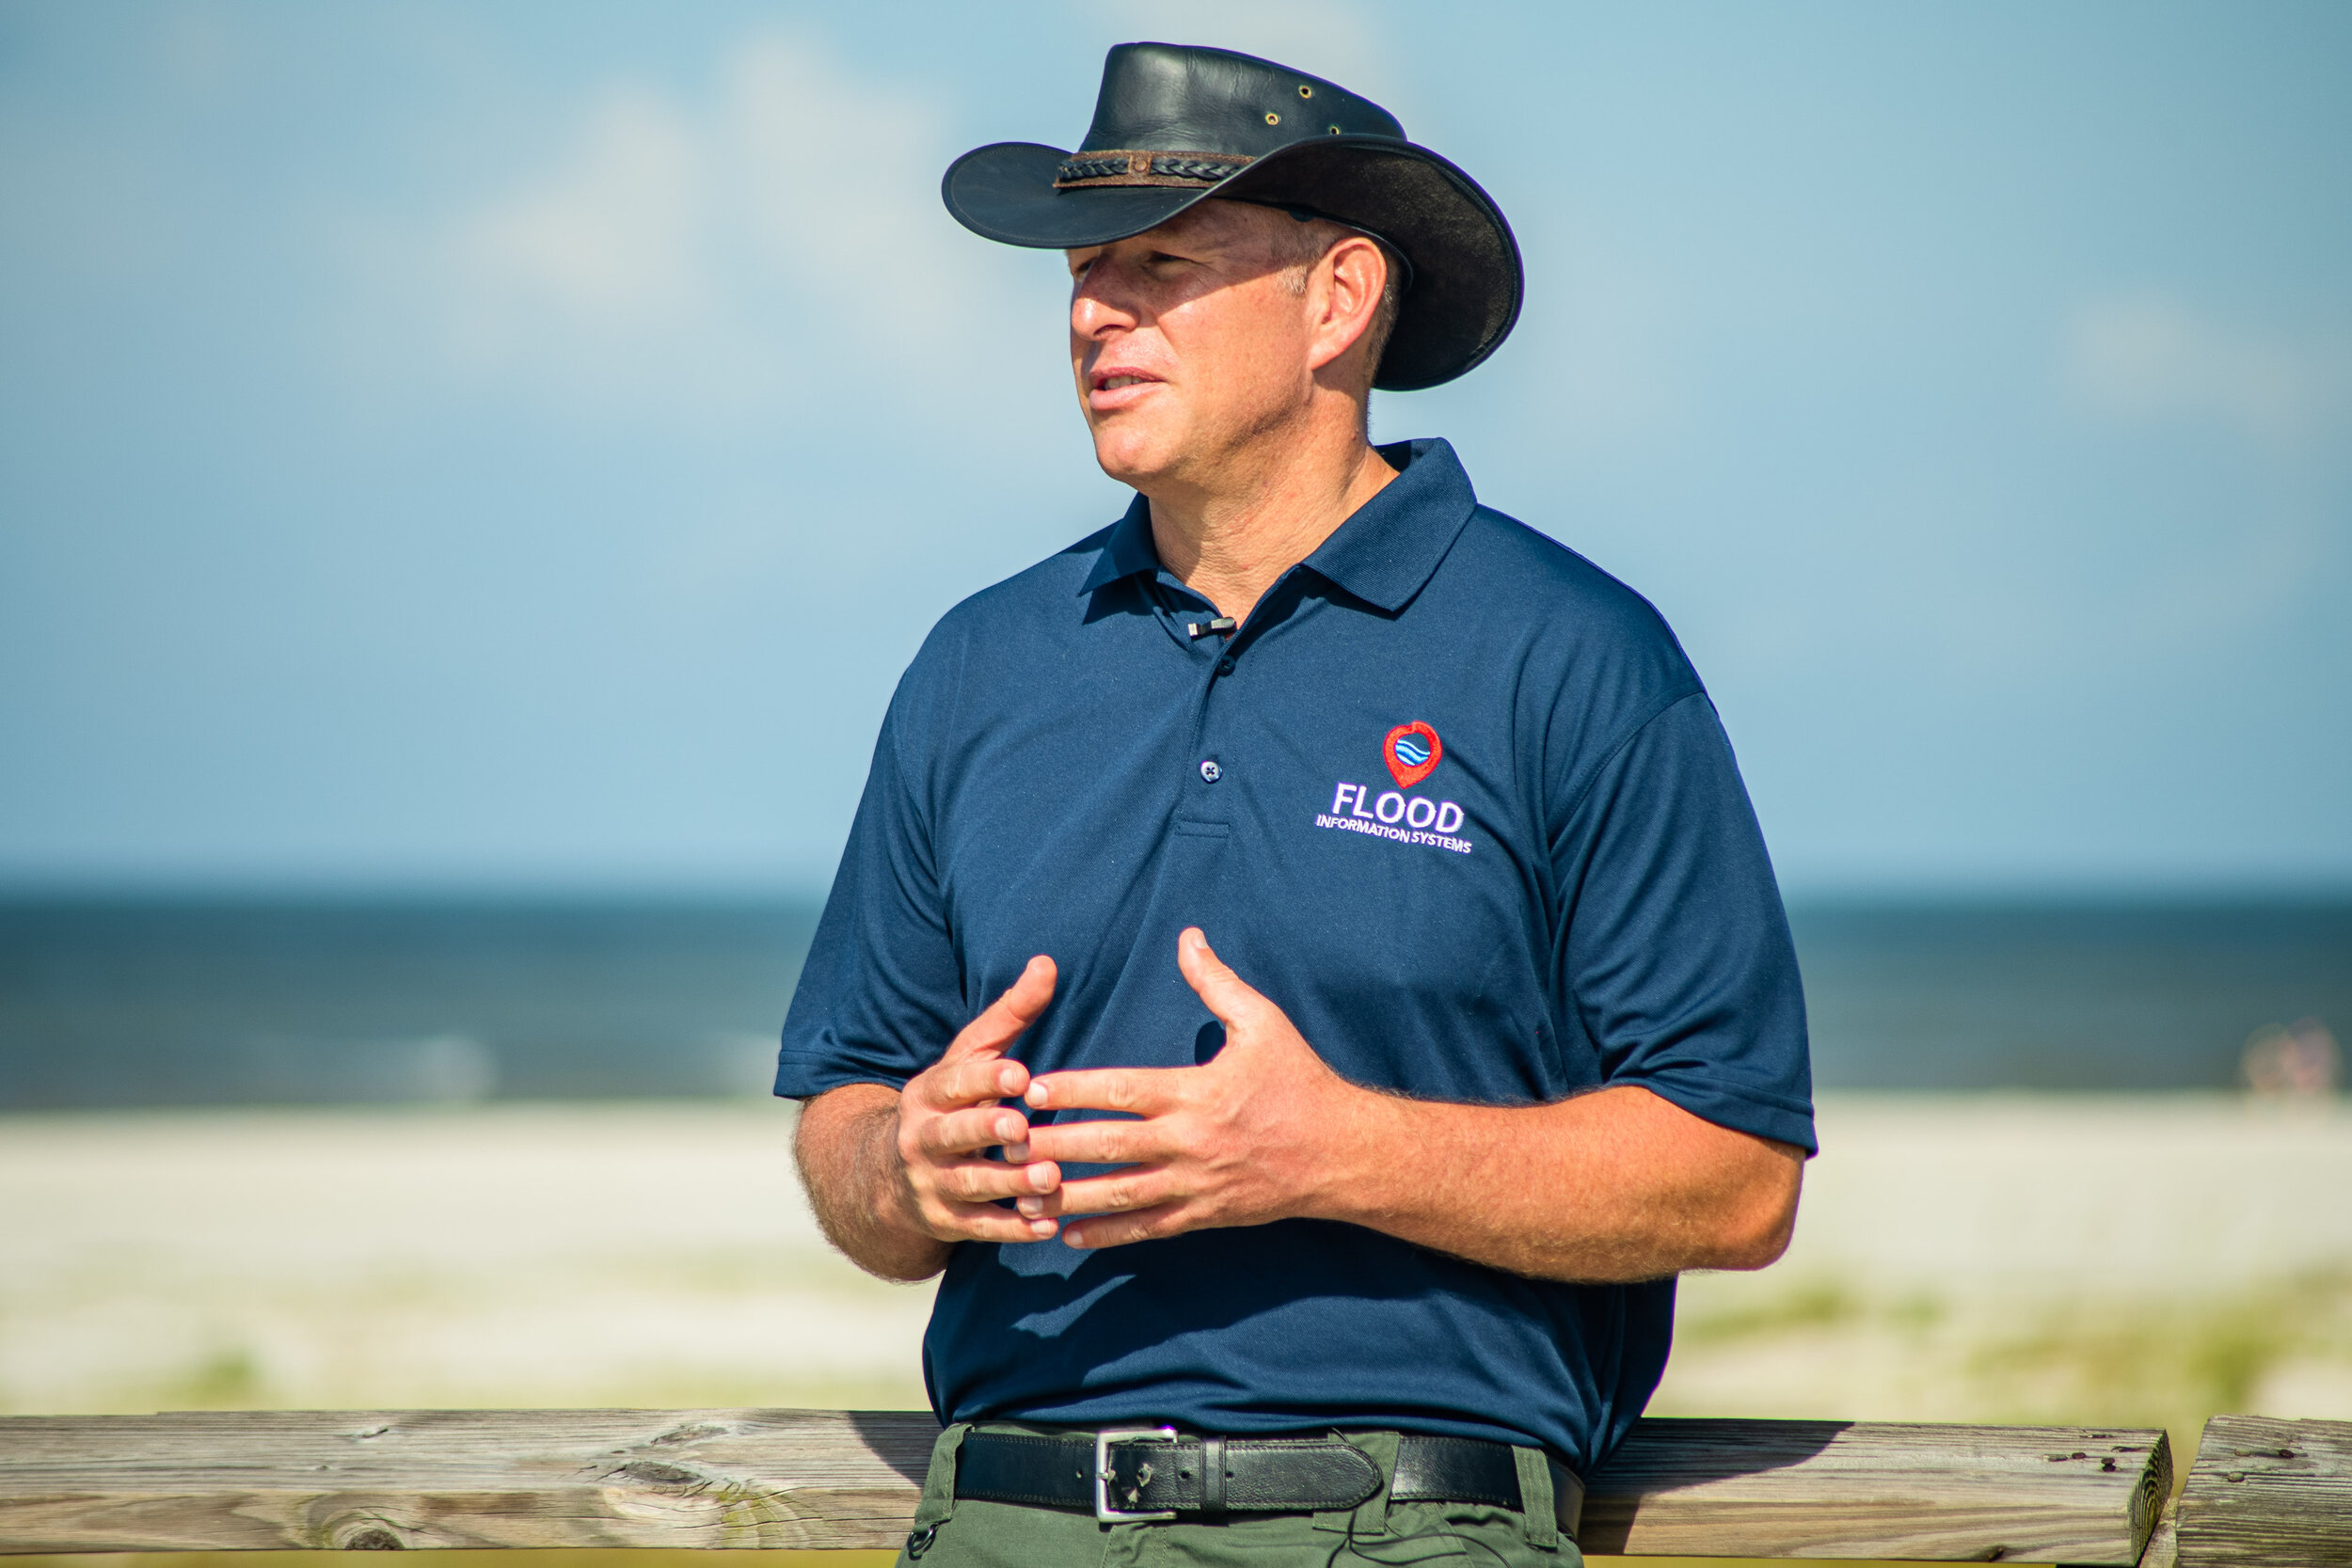
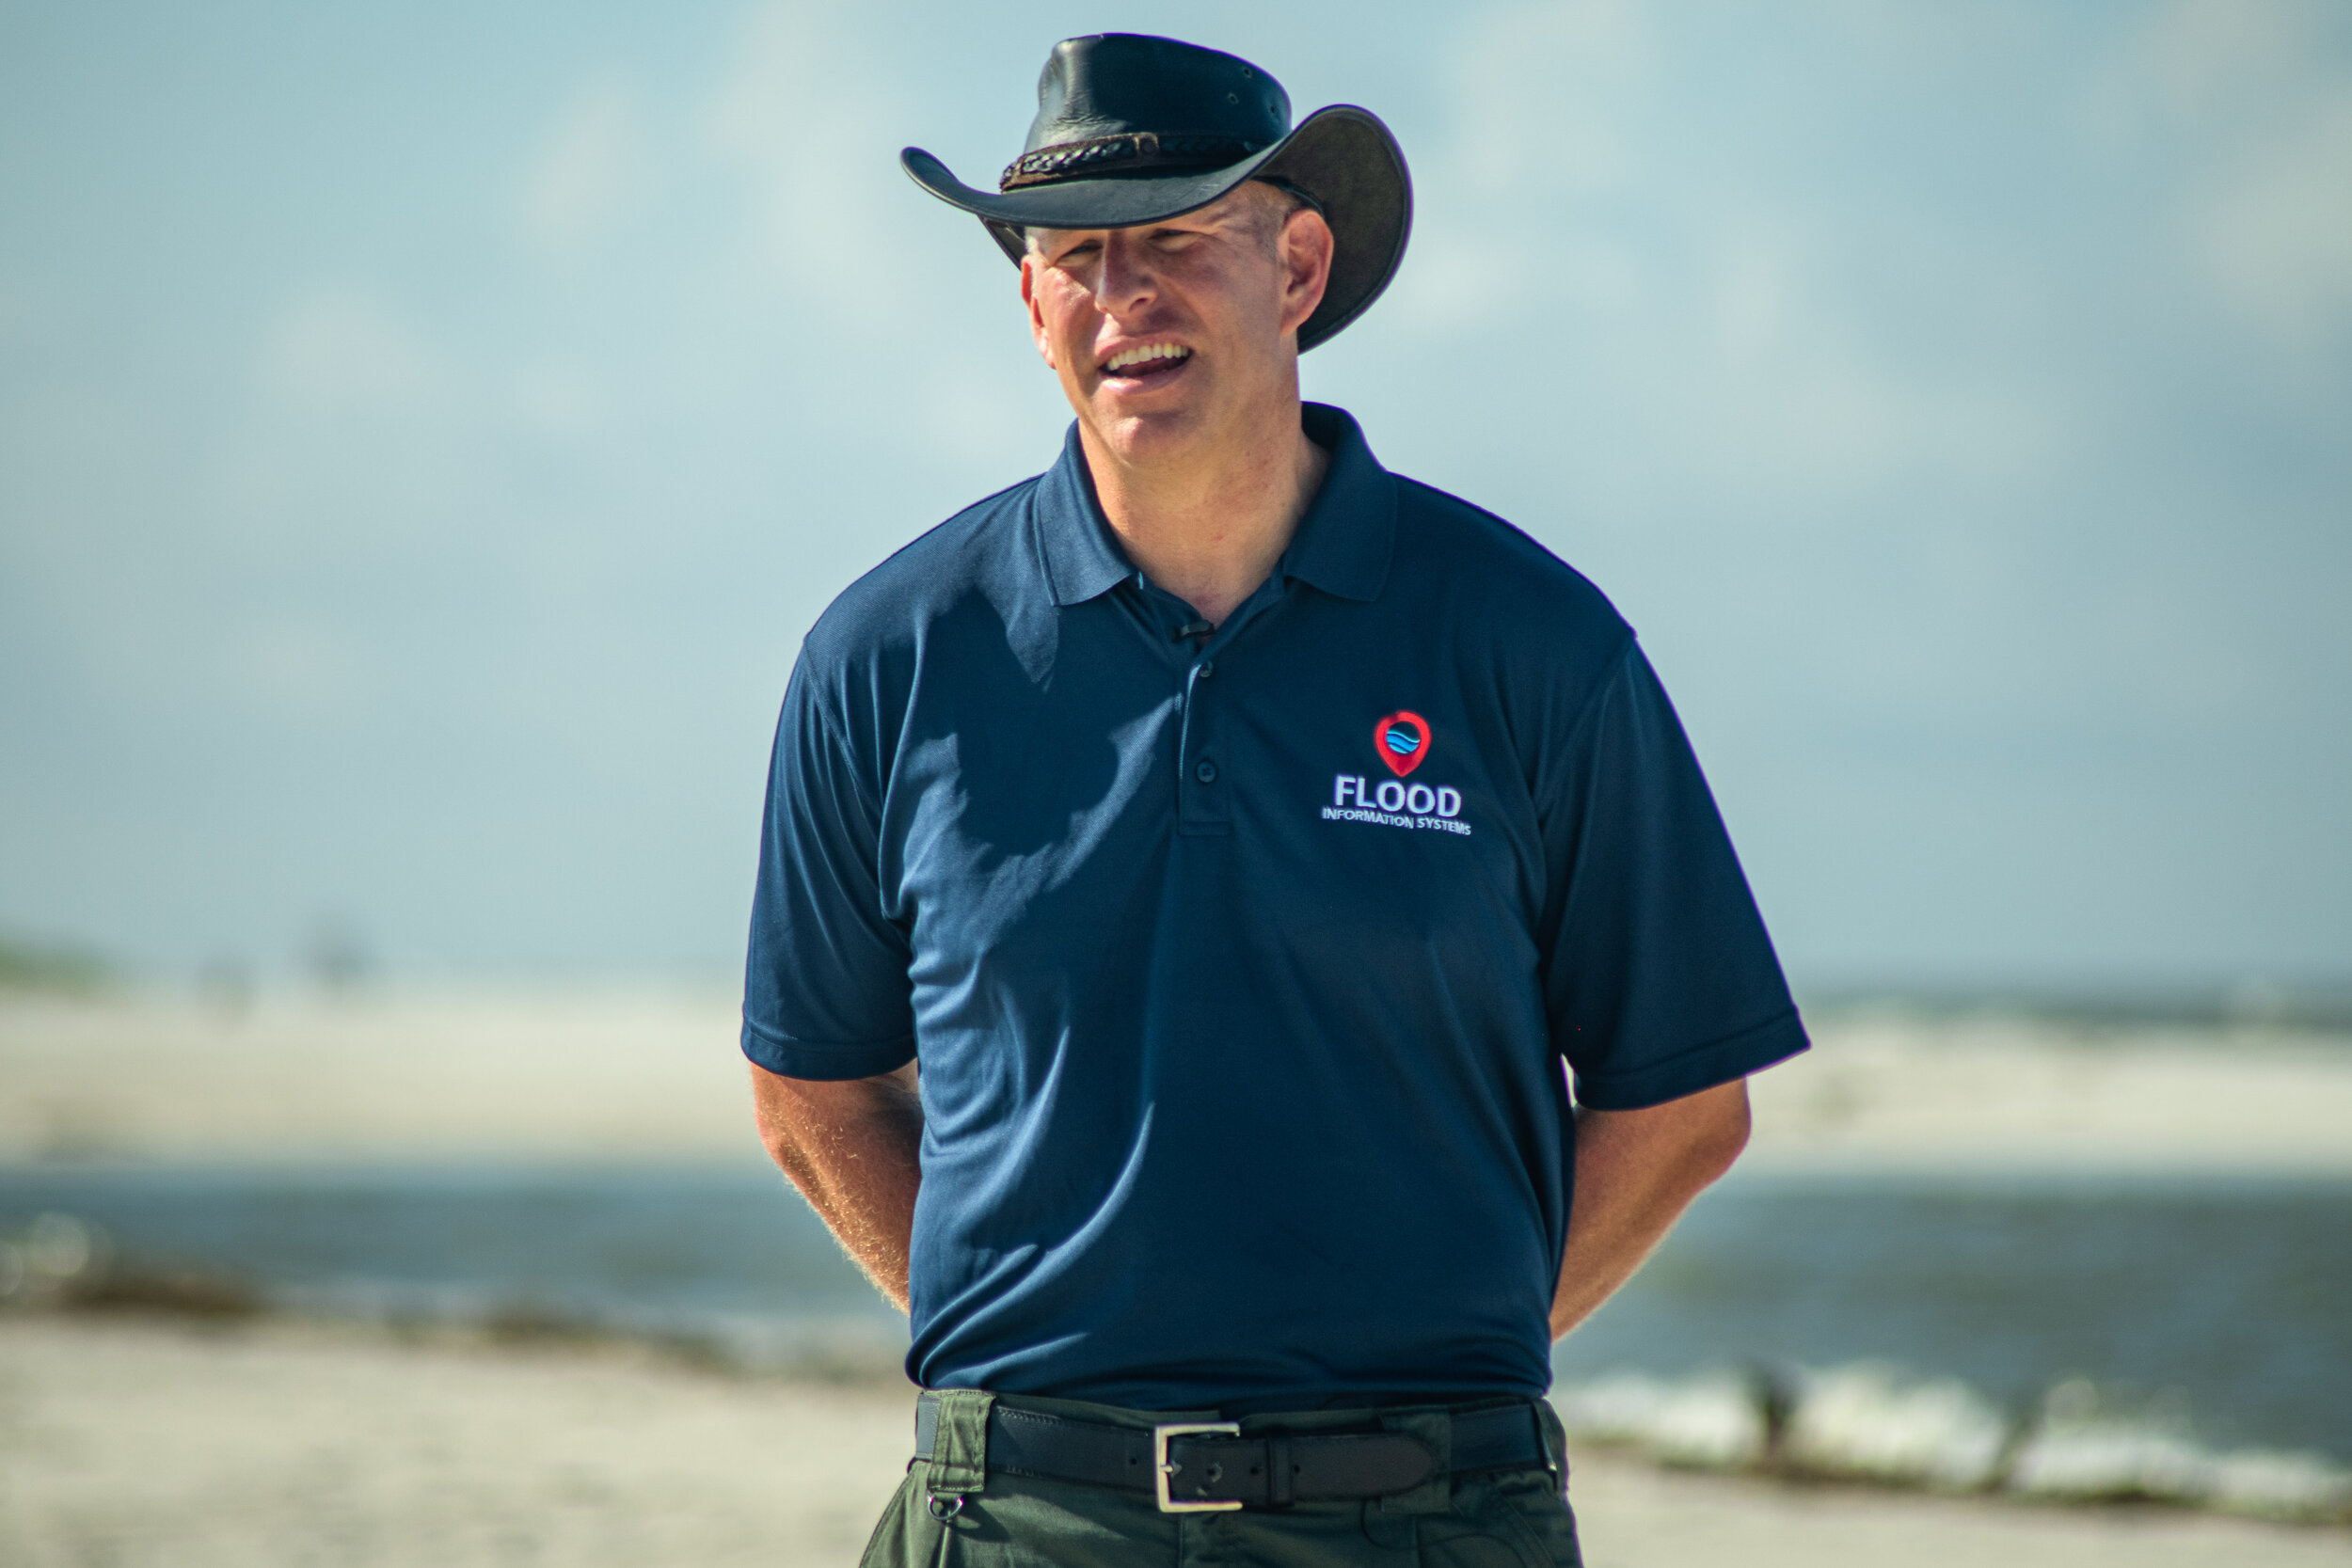
Dr. Hal Needham is a climate data and natural hazards scientist with over 15 years of experience and leads the team at Flood Information Systems (FIS). FIS conducts data-driven risk analysis for disaster-prone communities, utilizing cutting-edge statistical methodologies and data development to improve frequency analysis of low-frequency/ high-magnitude natural disasters. Dr. Hal has innovated geospatial mapping techniques to improve disaster impact maps that quantify risks to buildings and infrastructure. He also directs the U-Surge Project, which provides the first coastal flood climatology for communities from Texas to Maine. Dr. Hal resides in Galveston, Texas, the site of the deadliest natural disaster in U.S. history. He has obtained a B.S. from Penn State University and M.S. and doctoral degrees from Louisiana State University.
Media appearances
VIDEO
Services
MAPPING
Storm surge mapping
Storm surge/storm tide maps display the spatial extent of storm surge/ storm tide observations, as well as the hourly track and intensity of the hurricane that generated the coastal flooding event.
Available for 300+ storms since 1880.
REAL ESTATE
Flood inundation tool
The Flood Inundation Tool estimates potential water depth inside buildings.
REAL ESTATE
Change in appraised values after past hurricane map
The Change in Appraised Values after Past Hurricane Map depicts the change in property values after past hurricanes from a geographic perspective. The tool provides you with a sense of geographic clusters, enabling you to obtain a better picture of flood risk. Following hurricanes, most cities have one or more clusters of homes that APPRECIATE, usually in areas that were untouched by floodwaters.
REAL ESTATE
Flood risk window tool
Nobody buys a home for one year. Yet, we hear that homes in the 100-year flood plain have a 1% chance of flooding annually. A more important question to ask is, "What is the chance my home will flood in a 30-year mortgage?" The Flood Risk Window Tool enables you to select a window into the future and see actual flood risk. Many homeowners are shocked to see that a home on the edge of the 100-year floodplain has a 26% chance of flooding in a 30-year mortgage.
